How to Read Cryptocurrency Market Charts
- Understanding the basics of cryptocurrency market charts
- Analyzing different types of cryptocurrency market charts
- Identifying key indicators on cryptocurrency market charts
- Using technical analysis to interpret cryptocurrency market charts
- Strategies for making informed decisions based on cryptocurrency market charts
- Common mistakes to avoid when reading cryptocurrency market charts
Understanding the basics of cryptocurrency market charts
When it comes to understanding the basics of cryptocurrency market charts, it is essential to familiarize yourself with the various elements that make up these charts. Cryptocurrency market charts typically display the price movements of a particular cryptocurrency over a specific period. These charts can provide valuable insights into the market trends and help traders make informed decisions.
One of the key components of a cryptocurrency market chart is the price axis, which shows the price of the cryptocurrency being tracked. The time axis, on the other hand, displays the time period over which the price movements are being charted. By analyzing the intersection of these two axes, traders can identify patterns and trends in the market.
Candlestick charts are commonly used in the cryptocurrency market to represent price movements. Each candlestick typically represents a specific time period, such as one hour or one day. The body of the candlestick indicates the opening and closing prices, while the wicks show the highest and lowest prices reached during that time period.
Traders can also use various technical indicators, such as moving averages and relative strength index (RSI), to analyze cryptocurrency market charts and predict future price movements. These indicators can help traders identify potential buying or selling opportunities based on historical price data.
Analyzing different types of cryptocurrency market charts
When analyzing different types of cryptocurrency market charts, it is important to understand the various indicators and patterns that can help in making informed trading decisions. There are several types of charts commonly used in the cryptocurrency market, each providing unique insights into price movements and trends.
One of the most popular types of charts is the candlestick chart, which displays price movements over a specific time period. Candlestick charts provide information on the opening, closing, high, and low prices for a given cryptocurrency, allowing traders to quickly assess market sentiment and potential price direction.
Another commonly used chart type is the line chart, which connects closing prices over a specified time frame. Line charts are useful for identifying long-term trends and can help traders determine key support and resistance levels.
For more detailed analysis, bar charts can be used to display price movements in a more comprehensive manner. Bar charts show the opening, high, low, and closing prices for a specific time period, providing a visual representation of price volatility and market strength.
Lastly, volume charts can be used to analyze trading volume over time. By examining volume patterns alongside price movements, traders can gain insights into market liquidity and potential price reversals.
Overall, understanding how to read and interpret different types of cryptocurrency market charts is essential for successful trading in the volatile cryptocurrency market. By utilizing various chart types and indicators, traders can make more informed decisions and improve their overall trading strategies.
Identifying key indicators on cryptocurrency market charts
When looking at cryptocurrency market charts, it is essential to identify key indicators that can help you make informed decisions. These indicators can provide valuable insights into the market trends and potential price movements of various cryptocurrencies.
One of the most commonly used indicators is the moving average, which helps smooth out price fluctuations and identify trends over a specific period. By analyzing the moving averages of different cryptocurrencies, you can get a better understanding of their price movements and potential future directions.
Another important indicator to consider is volume analysis, which measures the amount of a particular cryptocurrency being traded over a specific period. High trading volumes can indicate strong market interest and potential price movements, while low volumes may suggest a lack of interest or market uncertainty.
Support and resistance levels are also crucial indicators to watch on cryptocurrency market charts. These levels represent points where the price tends to bounce back or reverse direction, indicating potential buying or selling opportunities. By identifying these levels, you can better predict price movements and set appropriate entry and exit points for your trades.
Additionally, technical indicators such as Relative Strength Index (RSI) and Moving Average Convergence Divergence (MACD) can provide further insights into the strength and momentum of a cryptocurrency’s price movements. By analyzing these indicators alongside other key metrics, you can develop a more comprehensive understanding of the market dynamics and make more informed trading decisions.
Using technical analysis to interpret cryptocurrency market charts
When it comes to interpreting cryptocurrency market charts, technical analysis plays a crucial role in understanding the trends and patterns that can help predict future price movements. By analyzing historical price data and volume, traders can identify potential entry and exit points for their trades.
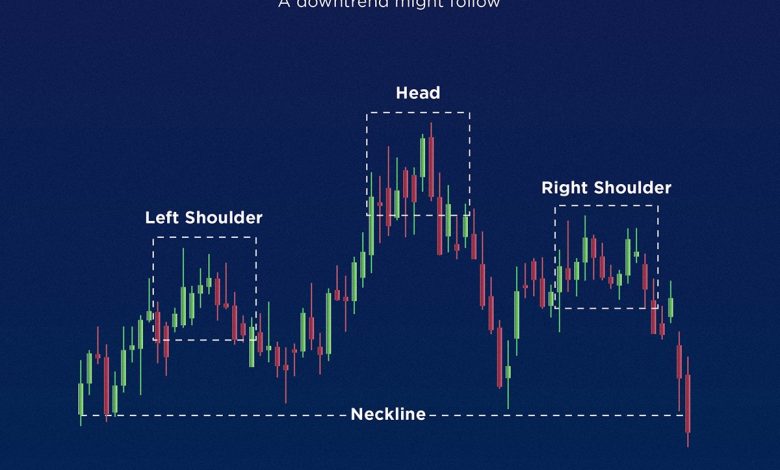
One of the key tools used in technical analysis is chart patterns, which are formations that occur on price charts and can indicate the direction in which the price is likely to move. Some common chart patterns include head and shoulders, double tops and bottoms, triangles, and flags.
Another important aspect of technical analysis is the use of indicators, which are mathematical calculations based on price and volume data. These indicators can help traders confirm trends, identify overbought or oversold conditions, and generate buy or sell signals.
It is essential for traders to combine chart patterns, indicators, and other technical analysis tools to form a comprehensive view of the market. By using a combination of these tools, traders can make more informed decisions and improve their chances of success in the cryptocurrency market.
Strategies for making informed decisions based on cryptocurrency market charts
When it comes to making informed decisions based on cryptocurrency market charts, there are several strategies that can be helpful. By analyzing the data presented in these charts, investors can gain valuable insights into the trends and patterns of various cryptocurrencies. Here are some key strategies to consider:
- Identify trends: One of the most important aspects of reading cryptocurrency market charts is identifying trends. By looking at the historical data, investors can determine whether a particular cryptocurrency is on an upward or downward trend. This information can help them make more informed decisions about when to buy or sell.
- Use technical analysis: Technical analysis involves studying past market data, primarily price and volume, to predict future price movements. By using tools such as moving averages, support and resistance levels, and chart patterns, investors can make more accurate predictions about the direction of a cryptocurrency’s price.
- Consider market indicators: Market indicators, such as the Relative Strength Index (RSI) or Moving Average Convergence Divergence (MACD), can provide valuable information about the strength and momentum of a cryptocurrency’s price movements. By paying attention to these indicators, investors can better understand market conditions and make more informed decisions.
- Set stop-loss orders: To manage risk effectively, investors can use stop-loss orders to automatically sell a cryptocurrency if its price falls below a certain level. This can help protect against significant losses and ensure that investors stick to their predetermined trading strategies.
- Diversify your portfolio: Diversification is key to reducing risk in the volatile cryptocurrency market. By investing in a variety of cryptocurrencies, investors can spread out their risk and potentially increase their chances of making profitable trades.
By following these strategies and regularly analyzing cryptocurrency market charts, investors can make more informed decisions and increase their chances of success in the cryptocurrency market.
Common mistakes to avoid when reading cryptocurrency market charts
When reading cryptocurrency market charts, there are several common mistakes that traders should avoid to make informed decisions. One of the most common mistakes is overtrading, which can lead to unnecessary losses. It is important to have a clear strategy and stick to it, rather than making impulsive trades based on short-term fluctuations.
Another mistake to avoid is ignoring fundamental analysis. While technical analysis is important when reading market charts, it is also crucial to consider the underlying factors that can impact the value of a cryptocurrency. This includes news, regulations, and market sentiment.
Additionally, traders should be cautious of confirmation bias. This is the tendency to interpret information in a way that confirms one’s preexisting beliefs. It is important to remain objective when analyzing market charts and consider all possible outcomes, rather than just looking for evidence that supports a particular view.
Lastly, it is essential to avoid relying solely on past performance when reading cryptocurrency market charts. While historical data can provide valuable insights, it is not a guarantee of future results. Traders should consider a combination of factors, including current market conditions and trends, to make well-informed decisions.